

Every year the Highway Safety Section of the Nebraska Department of Transportation prepares a Traffic Crash Facts report. The 2020 Traffic Crash Facts report provides a number of important insights on the dangers facing motorists, their passengers, and others on Nebraska’s roads.
Keep reading for more information about the rate of car accidents in Nebraska, what causes collisions, and more. If you have been injured or lost a loved one in a crash, contact a car accident attorney at Hauptman, O’Brien, Wolf & Lathrop for free today.
How Many Car Accidents Happened in Nebraska in 2020?
In 2020, Nebraska was home to 1,474,924 licensed drivers operating 2,398,328 registered vehicles. The vast majority of these drivers were not involved in accidents last year. However, for those who were, a significant number had their lives turned upside down.
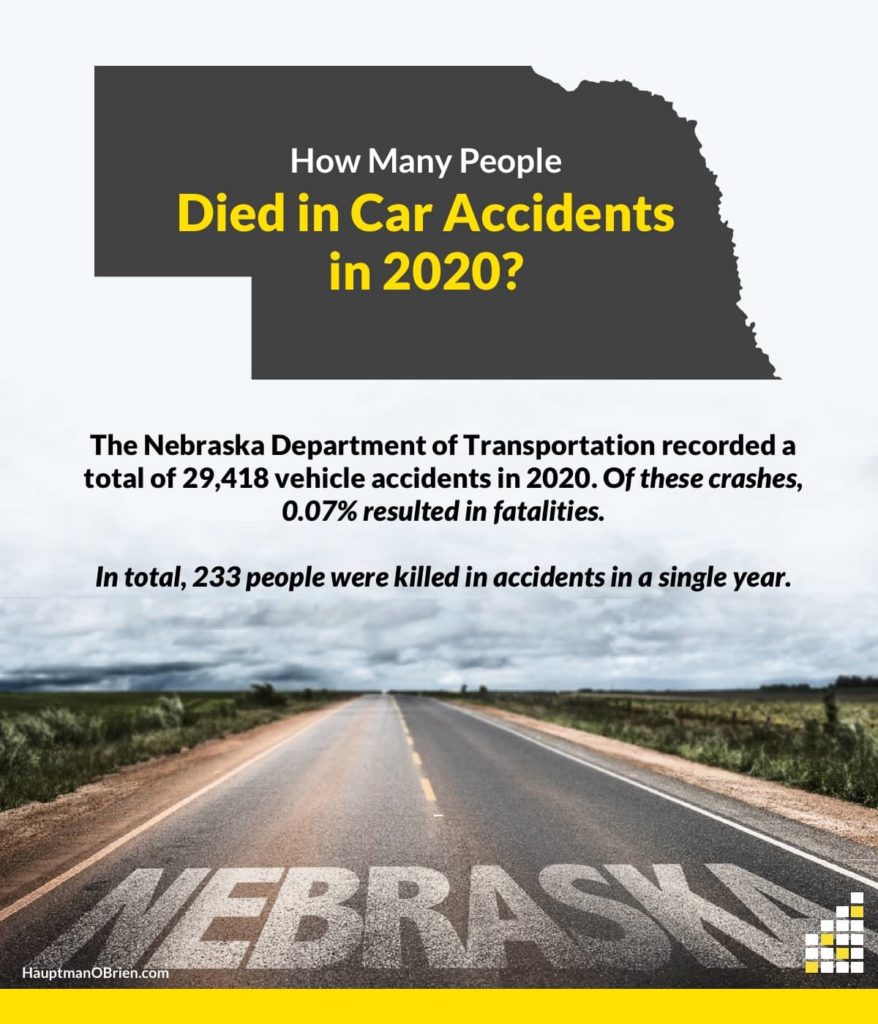
The Nebraska Department of Transportation (NDOT) recorded a total of 29,418 vehicle accidents. These accidents are categorized as follows:
- Fatal crashes: 217
- 0.07% of accidents resulted in fatalities
- Crashes involving injury: 9,847
- 33.47% of accident resulted in some degree of injury
- Property damage only (PDO) crashes: 19,354
In total, 233 people were killed and 14,100 people were injured in car accidents in Nebraska last year. One crash occurred every 18 minutes, an average of 39 people were injured each day, and an accident fatality occurred once every 38 hours.
The fatality rate per 100 million miles driven was slightly higher last year than the year before. In 2019, 1.16 people were killed per 100 million miles driven. In 2020, this rate rose to 1.2.
The economic loss associated with traffic accidents in 2020 was $4,708,415,810 (more than $4 billion).
What Are the Most Common Types of Accidents in Nebraska?
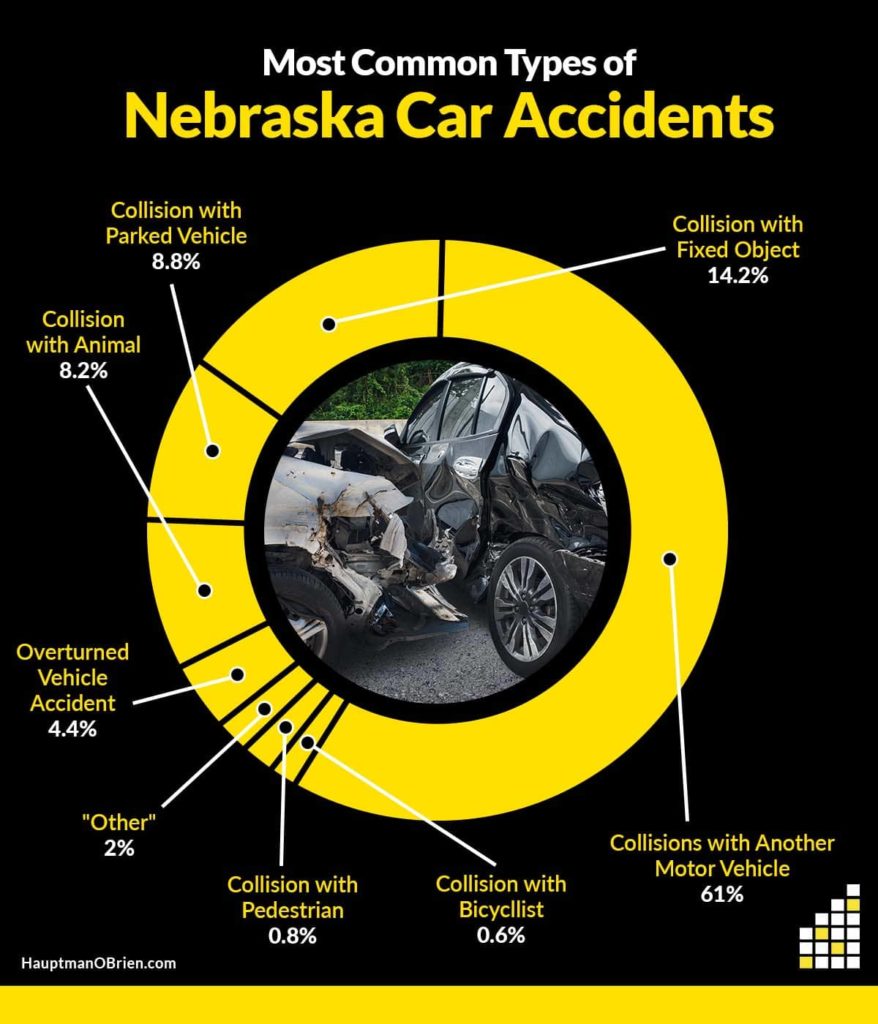
Motor vehicle accidents are categorized according to the first harmful event (i.e., the event that resulted in injury, death, or property damage). In 2020, the types of accidents by first harmful event were:
- 61% of the state’s collisions were between two motor vehicles. However, these crashes accounted for a smaller portion of fatal accidents: 46.1% (still a significant percentage).
- 14.2% of crashes were between a vehicle and a fixed object (accounting for 20.7% of traffic deaths).
- 8.8% were between a moving vehicle and a parked vehicle (no deaths recorded).
- 8.2% were between a vehicle and an animal (accounting for 1.4% of motorist deaths).
- 4.4% involved an overturned car but no collision (accounting for an astounding 21.2% of deaths).
- Only 0.8% of crashes involved a motor vehicle striking a pedestrian. However, these accidents were responsible for 6.9% of the state’s traffic deaths — a testament to just how serious pedestrian accidents tend to be.
- 0.6% involved a motor vehicle striking a bicyclist (no deaths recorded, perhaps surprisingly).
- 2% of accidents (and 2.8% of deaths) were recorded as “Other” (signifying a first harmful event where no collision occurs)
Collisions between motor vehicles account for the majority of accidents and fatalities in Nebraska. However, it is important not to assume that you are at fault just because another vehicle was not involved. Multiple parties may be liable in an auto accident claim.
What Causes Car Accidents?
The NDOT assesses the “driver contributing circumstances” in evaluating how and why accidents occur. In 2020, the most common cause of accidents was failure to yield. A total of 4,251 crashes were attributable to this infraction, resulting in 19 deaths and 1,886 injuries.
The other top causes of accidents stemming from driver error include:
- Inattention
- 3,082 total accidents
- 9 fatal accidents
- 964 accidents involving injuries
- Following too closely
- 2,560 total accidents
- 1 fatal accident
- 1,033 accidents involving injuries
- Operating in an erratic manner
- 2,058 total accidents
- 29 fatal accidents
- 917 accidents involving injuries
- Left lane/run off the road
- 1,769 total accidents
- 36 fatalities
- 651 accidents involving injuries
- Disregarding traffic controls
- 1,710 total accidents
- 12 fatal accidents
- 903 accidents involving injuries
- Speed too fast for conditions
- 1,446 total accidents
- 11 fatal accidents
- 459 accidents involving injuries
- Other improper action
- 1,151 total accidents
- 24 fatal accidents
- 400 accidents involving injuries
- Other distractions
- 711 total accidents
- 4 fatal accidents
- 267 accidents involving injuries
- Making an improper turn
- 449 total accidents
- 3 fatal accidents
- 119 accidents involving injuries
- Swerving or avoiding
- 430 total accidents
- 4 fatal accidents
- 146 accidents involving injuries
- Visibility obstructed
- 342 total accidents
- 1 fatal accident
- 93 accidents involving injuries
- Fatigued/asleep at the wheel
- 286 total accidents
- 0 fatal accidents
- 135 accidents involving injuries
- Defective equipment
- 179 total accidents
- 1 fatal accident
- 60 accidents involving injuries
- Exceeding speed limit
- 134 total accidents
- 7 fatal accidents
- 87 accidents involving injuries
- Mobile phone distraction
- 131 total accidents
- 0 fatal accidents
- 51 accidents involving injuries
Another scenario where accident risk increases is driving through a work zone. However, work zone crashes in 2020 decreased by over 30% (from 991 to 688). Fatalities in work zone crashes were halved, from 10 deaths in 2019 to 5 in 2020.
Which Vehicles Are Involved in the Most Accidents?
Automobiles represent approximately 72% of the vehicles involved in accidents in Nebraska last year. Though 108 of these crashes were fatal and more than 7,500 resulted in injury, automobile accidents are not the most dangerous wrecks on Nebraska’s roads.
Overall, light and heavy truck accidents are the most dangerous type of crash. Accidents involving commercial trucks account for 53.7% of all fatal crashes.
Motorcycle accidents also have a disproportionately high rate of death. More than 10% of fatal crashes involve motorcycles, even though motorcycle accidents made up only about 0.08% of total wrecks in the state in 2020.
What Areas of Nebraska Are the Most Dangerous to Drive?
Perhaps unsurprisingly, the counties containing Nebraska’s major metropolitan areas reported the greatest proportion of accident fatalities:
- Douglas County: 46 accident deaths
- Lancaster County: 18 accident deaths
- Lincoln County: 12 accident deaths
- Dodge County: 8 accident deaths
- Scottsbluff County and Saline County: 7 accident deaths each
Although a significant portion of the state’s accident fatalities occurred in these counties, deaths on rural roadways actually outnumber those that occur on interstate highways and other urban roads. The difference is nearly two to one, with the NDOT recording 78 deaths on urban roads and 155 deaths on rural roads.
Intersection vs. Non-Intersection Crashes
Last year 46.5% of accidents involving multiple vehicles occurred at intersections. Meanwhile, only 14.2% of multi-vehicle crashes occurred outside of intersections.
The NDOT recorded the following data for crashes at intersections:
- Angle/T-Bone Accidents
- 45.8% of intersection accidents
- 43.1% of crashes resulted in injury
- Rear-End Accidents
- 29.6% of intersection accidents
- 40.6% of crashes resulted in injury
- Left Turn/Leaving Accidents
- 12.1% of intersection accidents
- 49.5% of crashes resulted in injury
- Sideswipe Accidents – Vehicles Traveling Same Direction
- 8.5% of intersection accidents
- 21% of crashes resulted in injury
- Backing Accidents
- 2.2% of intersection accidents
- 10.8% of crashes resulted in injury
- Sideswipe Accidents – Vehicles Traveling Opposite Direction
- 1.3% of intersection accidents
- 31.5% of crashes resulted in injury
- Head-On Collisions
- 0.4% of intersection accidents
- 53.8% of crashes resulted in injury
Rear-end accidents account for nearly half of the collisions outside of intersections. These accidents result in injury 40% of the time, making it essential for drivers to exercise caution at intersections, on straightaways, and other areas when they are following another vehicle.
What Road Conditions Are Most Dangerous?
The majority of auto accidents (79.2%) and especially fatal crashes (85.5%) occurred on dry roads. Only a small minority of accidents in both categories involved roads that were wet (8.8% and 6.1%, respectively) or had ice and snow (9.6% and 6.5%, respectively). Although inclement weather can increase the risk of an accident, these statistics reveal the important role of driver attentiveness in avoiding crashes when no hazardous weather is present.
What Time of Day Is the Most Likely to Be Involved in a Car Accident?
Last year, more motor vehicle accidents happened on Friday (16.6%) than any other day of the week. However, the worst day of the week for fatal accidents was Saturday (18.4%).
Those driving between 3 p.m. and 6 p.m. were at the greatest risk of being involved in a crash, with 23.1% of collisions happening during this time period. The worst time for fatalities, however, was 9 a.m. to noon (with 18% of fatal accidents occurring at this time).
Accident totals reached their peak in January 2020, with 3,159 crashes happening in the first month of the year. Fatalities, however, were at their highest from June to September of last year, with 108 deaths (nearly half of the year’s total accident deaths) recorded in just four months.
What Demographics Are at the Highest Risk of an Accident?
According to NDOT data from 2020, the likelihood of being in an accident correlates strongly with the age of the driver. Different age groups make up the following percentages of victims in accidents:
- 15-24: 28%
- 25-34: 21%
- 35-44: 16.2%
- 45-54: 12.6%
- 55-64: 11.7%
- 65-74: 6.8%
- 75+: 3.6%
The likelihood of being in a fatal accident, however, doesn’t exactly correspond to the overall trend of accident risk decreasing with age:
- 15-24 and 25-34: 21.5% each
- 55-64: 16.6%
- 35-44: 13.9%
- 45-54: 11.5%
- 65-74: 9.7%
- 75+: 5.4%
Gender is another important factor to consider. Male drivers are much more likely to be in an accident (58.2%), suffer injury (56%), or be killed in a crash (75.8%) than their female counterparts. Indeed, only 24.2% of fatalities in vehicle accidents are female.
How Many Accidents Involved Alcohol?
Reducing the incidence of crashes caused by impaired driving is a major priority identified by the NDOT in this year’s Traffic Crash Facts. Unfortunately, there is still a long way to go before drunk driving accidents are a thing of the past.
Alcohol was involved in a staggering 33.2% of fatal accidents recorded last year. This represents a significant increase from the prior year, when alcohol was a factor in 24% of fatal crashes (a 10-year low).
Why Seat Belts Are Crucial
State and federal data show that 81% of motorists in Nebraska wear seat belts. Since 1993, wearing a seat belt has been required by law.
Unfortunately, lack of seat belt use is a major contributor to the severity of injuries in an accident. Seat belts were not used in 34.4% of crashes resulting in suspected serious injuries. The impact of not using a seat belt is even more pronounced in deadly accidents, with restraints not used in 63.5% of crashes involving fatal injuries.
Don’t Be a Statistic: Contact a Car Accident Lawyer Today
Although these numbers provide an informative snapshot of the dangers you might face driving in Nebraska, they do not take into account the impact an accident has on your life and that of your loved ones. Every accident is unique, which is why it is crucial to seek help from an attorney as soon as possible if you were injured or a family member was hurt or killed in a crash.
Hauptman, O’Brien, Wolf & Lathrop is the most experienced personal injury law firm in the area. Our attorneys have more than 268 years of combined experience, and we have recovered millions on behalf of clients harmed in motor vehicle accidents.
Please call (402) 241-5020 today for a free case review. The car accident lawyers at Hauptman, O’Brien, Wolf & Lathrop serve clients in Omaha, Sarpy County, and all of Nebraska, as well as nearby Iowa.
This was the 1st time I’ve ever had to use this type of service. Hands down would recommend this team for all your injury needs. They were professional, made sure everything was understood and was by my side step by step. I really felt like they were in my corner at all times!
Kathryn Hartnett went above and beyond to meet my needs as a unexpected life change happened. Everyone from the front desk to the back where amazing! Thank you so much!